






At the American Academy of Ophthalmology 2026 meeting in New Orleans, Rahul Bhola, MD, MBA, Sara Burns Rapuano, MBA, OCS, and Heather Hambrick Dunn, COA, OCS, OCSR, discussed revenue cycle management using key performance indicators (KPIs) and why they matter for ophthalmology practices. In the course, "Revenue Cycle Management Using Key Performance Indicators," they said KPIs are essential tools for monitoring and evaluating a practice’s financial health and provide critical insights into areas that may fall outside normal limits and require attention.
"A healthy revenue cycle is not simply about getting paid; it is what allows a practice to sustainably deliver excellent patient care," said Dr. Bhola. "Physicians and practice leaders need to understand the key performance indicators that drive the revenue cycle, because identifying problems early and addressing their root causes protects both the financial health of the practice and our ability to invest in our patients, our people, and the technology needed to provide high-quality care."
Rapuano emphasized that revenue cycle is a team sport. “Every member of your practice team is involved in ensuring you can get fair reimbursement for the services provided,” she said. “It is an administrator's responsibility to ensure a good working relationship between your billing team and your entire office so that the team can create KPIs and effectively use those KPIs to ensure continuous revenue cycle management process improvement" (Figure 1).
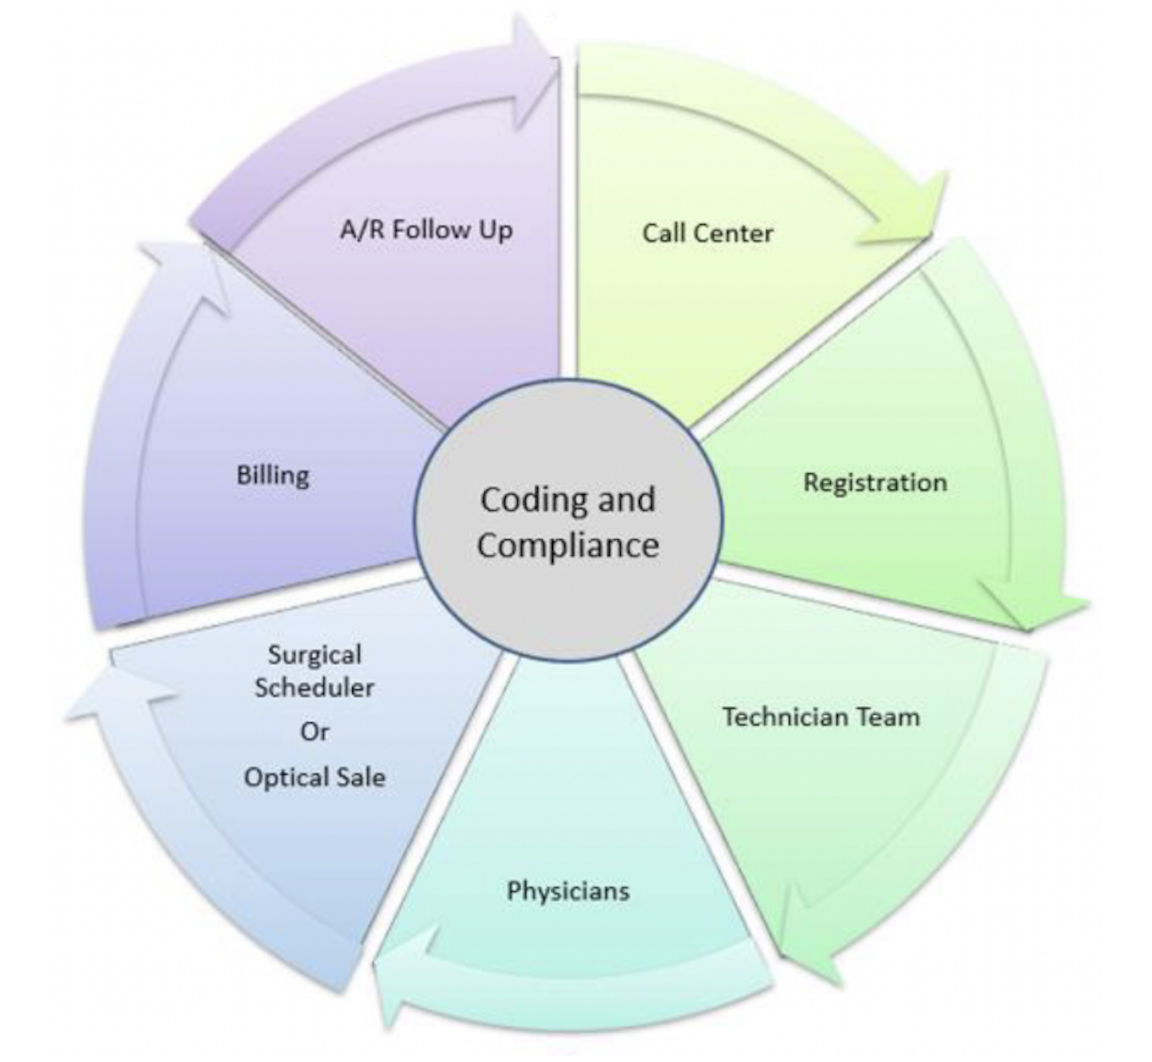
Identify Key Benchmark Categories
The presenters noted that this data lives in a practice’s existing practice management system (accounts receivable [A/R] aging reports, run by payer, financial class, or service type); clearinghouse dashboards (claim status, rejections, and denials—eg, a scrubber's rejections dashboard with error alerts); and in financial accounting books (monthly financial statements and bank deposit reconciliation).
The presenters then provided key financial metrics that ophthalmology practices can follow:
KPI: Average Monthly Gross Charges
Rapuano explained that this can be calculated using total charges (trailing 12 months) ÷ 12. "This provides a monthly view of the revenue stream that lets you react mid-month if the practice is falling short," she said. "If it's mid-month and charges aren't roughly half the monthly average, look for a root cause—a physician on vacation, a scheduling backlog, or understaffing."
Action steps a practice can take include monitoring daily charges vs average, identifying problems early, and knowing this before assessing A/R health. Rapuano also advised benchmarking against similar physician/practice types.
KPI: Average Monthly Gross Collections
This can be calculated by total cash collected (trailing 12 months) ÷ 12. "This will tell you whether collections are keeping pace with the practice's typical monthly rate," Rapuano explained. "Lower-than-average payments call for drilling into aging reports for submission delays, payer policy issues, coding errors, or rising denials."
Action steps to take include monitoring daily payments vs average, identifying problems early, and pairing with average monthly gross charges for a full revenue-stream view. Rapuano also advised practices to use as their own trailing baseline for future dashboards.
KPI: A/R Aging
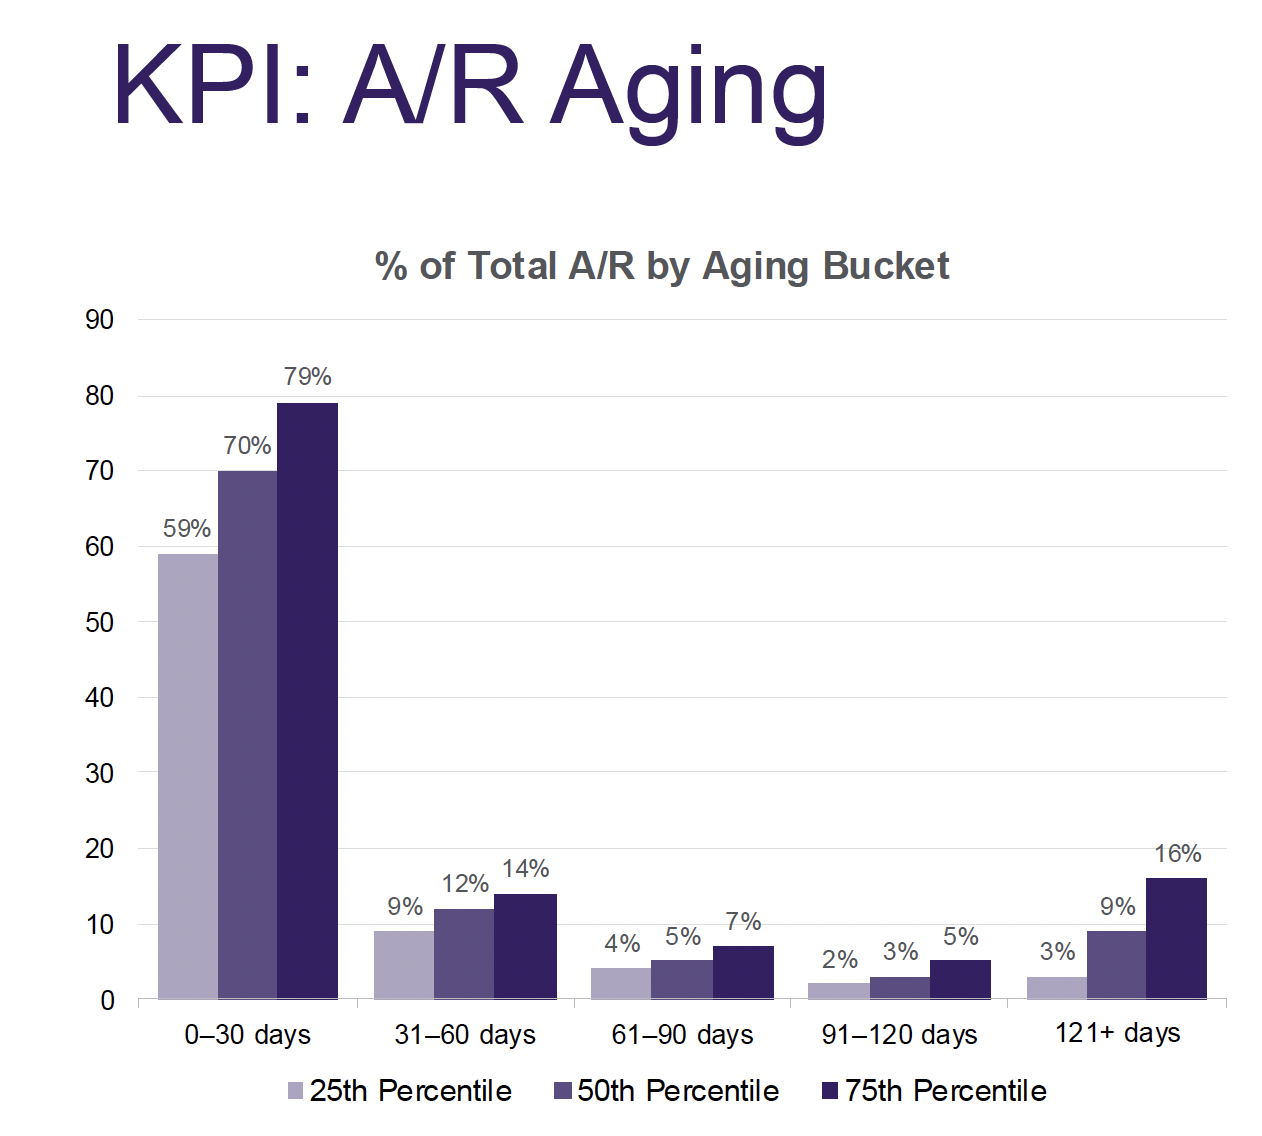
This can be calculated by days in A/R = total A/R ÷ (total charges ÷ 365). Dunn recommended to aim for under 25 days in A/R overall (varies by payer mix); healthy practices keep roughly 70% of A/R in the 0–30 day bucket, and a growing 91+ day balance is an early signal of collection breakdowns (Figure 2).
KPI: Days in A/R
Days in A/R can be calculated by total A/R ÷ (total charges ÷ 365). "This will tell you the average lifecycle of a claim—from the day it's billed to the day payment posts," Dunn noted. "Watch for delayed chart closure (5+ days postvisit) and claims held for missing information. These both drive AR days up. Also, make sure physicians close charts daily, review claims held in the claims inspector, and ensure all clearinghouse rejections are addressed daily." Dunn added that under 25 days is ideal, but that varies by payer.
KPI: Percentage Claim Denials and Rejections
This can be calculated by total denied claims ÷ total claims submitted (same period). "This information tells you rejections point to data-entry errors (demographics, ID number, DOB, coding errors); and denials point to eligibility, coverage, coding, medical-necessity, or documentation issues," Dunn explained. "Rejections are almost always avoidable—a rising rate usually signals a data-entry, eligibility-check gap, or coding issue."
Suggested action steps include correcting and rebilling rejected and denied claims quickly, analyzing the root cause of each, and providing eligibility and benefits or coding education as needed. Dunn said that a healthy benchmark is under 5% of submitted claims.
KPI: Credit Balance as a Percentage of Total A/R
This can be calculated by credit balances ÷ total A/R. "This tells you whether unresolved credit balances are masking your true net A/R—and whether patient refunds are falling behind," Dr. Bhola said. "High credit balances often mean prepayments or copayments weren't applied correctly, or corrected claims weren't posted accurately."
Recommended action steps include reviewing the copayment process, working credit balances weekly or monthly, and issuing refunds promptly per payer contract terms. A good benchmark Dr. Bhola said is 2%–3%.
"Your revenue cycle is a key indicator of your practice's financial health," Dunn explained. "Efficient billing and reimbursement processes support the resources needed to deliver exceptional patient care. Once a healthy revenue cycle is established, ongoing monitoring and preventive measures are essential to identify potential issues early and maintain long-term financial stability."